
- Introduction
iMaps is a free and powerful tool that allows you to search property, find ownership information, and conduct due diligence, all from the comfort of your computer.
Developers use iMaps as a powerful due diligence tool to research any property and neighborhood in Wake County. Conducting research in iMaps allows developers to find out:
- Who owns a piece of property?
- What is the assessed value of the property and improvements?
- What utilities are available to the site?
- What is the current zoning on the property and what is the proposed future land use for the area?
- What easements and water features may impact the property?
- And much more!
Below, you will learn how to use iMaps like a developer. I will highlight the key features of iMaps, and explain how and why to use them. I also include application exercises that allow you to test your newfound knowledge.
After reading this article, I want to hear from you! How do you use iMaps? What key concepts need further explanation? What questions do you have about the platform?
Reach out and let me know! You can email me directly at [email protected] or find me on Twitter at @OakCityCRE.
2. What is iMaps?
For the land-use curious there is no better tool to learn how to use than the Wake County GIS website, iMaps.
GIS — Geographic Information System.
The information in iMaps comes from many sources. One source includes various public maps created and maintained by Wake County and local municipalities. Another source is Wake County tax records. The Register of Deeds keeps a public record of each parcel of land in the County. iMaps puts all of this data in one place. Because the data is updated and maintained by the individual sources, iMaps is only as accurate and up to date as the separate databases.
Before the age of the internet, this information was publicly available, but a trip to the Register of Deeds office was required. The Wake County Register of Deeds is located in Downtown Raleigh at 300 South Salisbury Street, but thanks to iMaps you may never need to visit the Register of Deeds in person.
3. Why is iMaps Useful?
The best way to start due diligence on a property is to see the land in person. There is much that you will only learn about a place by seeing it in person. That said, there are several reasons that in-person due diligence may be impossible or impractical. Access is one key example. iMaps information is a fantastic resource as you are starting desktop due diligence.
Pro Tip: Never go onto a property that doesn’t belong to you or that you don’t have permission from the owner to access.
4. How to use iMaps
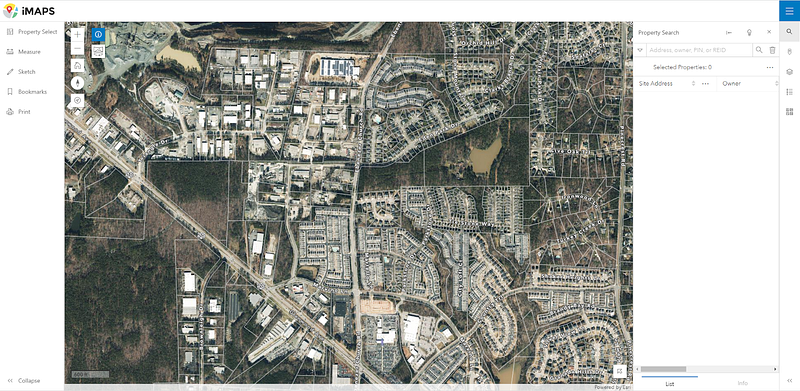
There are three main sections of the iMaps interface. The left side menu, the map, and the right side menu.
Tip: Your map may look different than the picture below. The iMaps website remembers your most recent map and layer settings.
iMaps also has a powerful mobile site, but this article focuses on the desktop version.
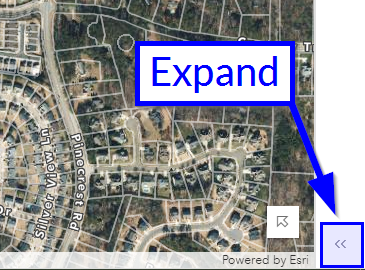
While you are learning the layout of the desktop site, it is best to expand the side menus by clicking the “expand” arrows at the bottom of each menu. This way all of the labels are visible.
5. Tools & Menus
In the sections below I will explore the most important tools from top to bottom, left to right.
5.1. Property Select
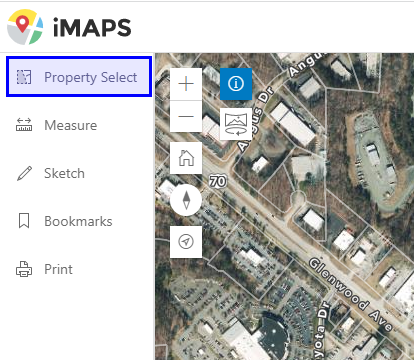
The first tool in the left side menu is the “Property Select” tool. Click the button and a submenu appears.
At the top of the Property Select submenu you see six different selection tools: Single Property, Line, Polygon, Rectangle, Circle, and Multi-point.
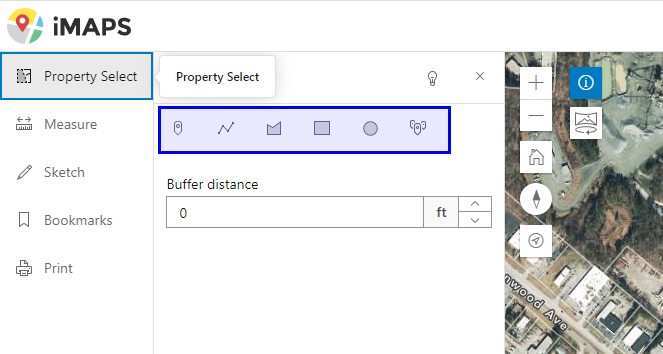
The most useful selection tools are Single Property, Line, and Multi-point. Typically, I am looking to find out information about one parcel. I use Single Property 99% of the time.
When you select a single property, the Property Search submenu opens and you see a bunch of data on the property. We will cover the data in this and later sections.
On the Property Select menu you will also see a Buffer Distance tool. By adding a buffer to your selection you will see which properties are within a specific distance from the property you select. This information comes in handy when you need to communicate with neighbors. For example, during a rezoning.
Unfortunately, the Multi-Property Selection tools don’t give you aggregate information on all of the properties selected, like total acreage. If I am looking at a potential assemblage, I usually skip straight to the Measure tools.
Assemblage: The process of purchasing multiple adjacent parcels to create a single larger and/or better parcel.
5.2. Measure
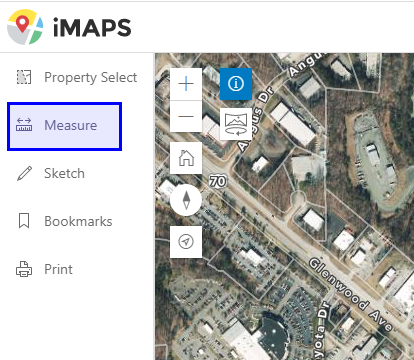
Below the Property Select menu you will see Measure. Click on the Measure menu and you see three tools. You can measure distance, area, and coordinates.
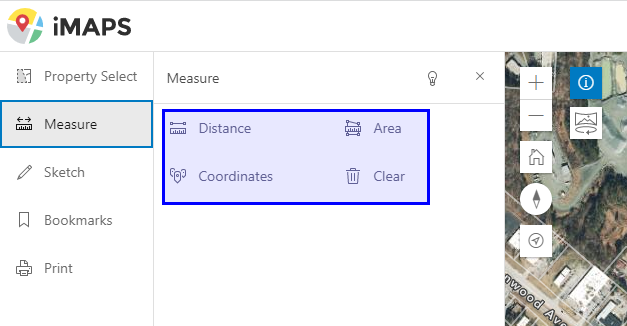
Distance and Area are the most useful measurements. With Distance you can measure the straight line distance between two points or the distance along a series of line segments. You can also use distance to quickly find the perimeter of a parcel or series of parcels, which is helpful when looking at a potential assemblage.
With the Area tool you can create an enclosed boundary — like your proposed assemblage — to find the total area.
Tip: Make sure you set the units of measurement before you use the Measure tools.
Pro Tip: An acre is 43,560 square feet. This is a handy fact to commit to memory. Converting square footage to acres and acres to square feet comes up all the time in real estate. It seems a little crazy, but I remember that if I take 3456 and switch the first two digits and add a zero I get the number of square feet in an acre. 3456 -> 43,560. [For some reason I find it easier to remember the series 3 to 6 and the reversal rule than the actual number.]
One Acre is 43, 560 square feet. Commit this to memory!
5.3. Layers
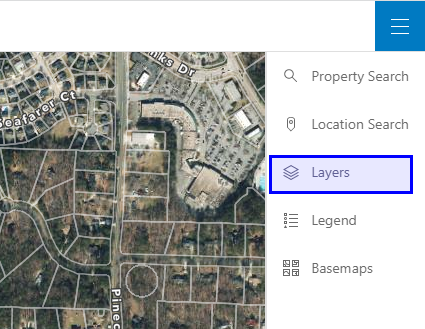
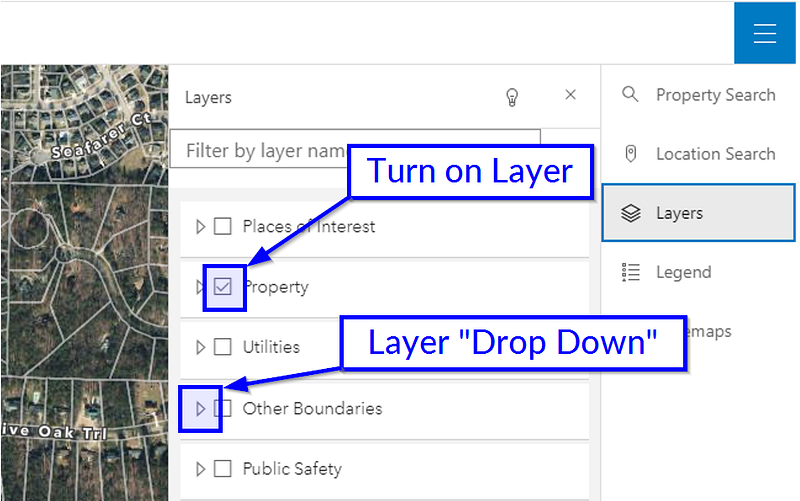
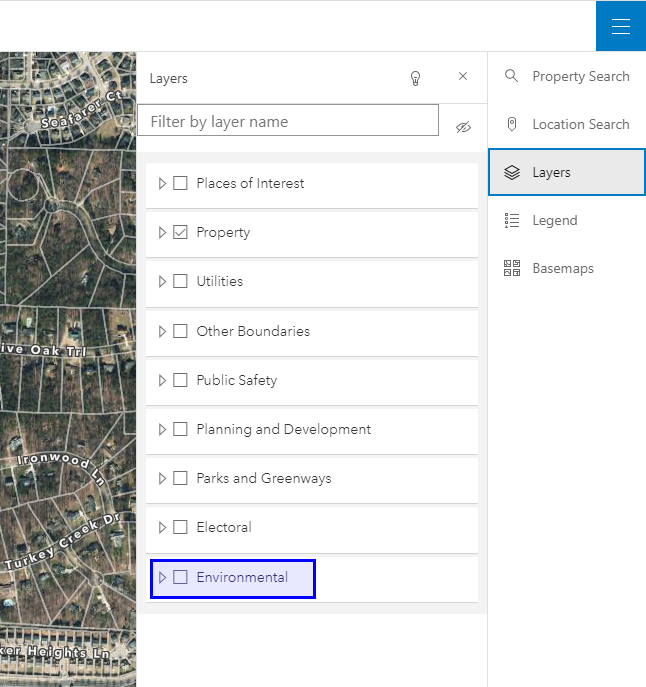
The icon third from the top of the right side menus is Layers. On this menu there is a wealth of information that you can overlay on the base map. The layer groups include: Places of Interest, Property, Utilities, Other Boundaries, Public Safety, Planning and Development, Parks and Greenways, Electoral, and Environmental. Some of these layers and sublayers are more useful to the developer than others, but take some time to explore them all. Below are descriptions and uses for some of the most useful sublayers. If you have trouble finding a layer you can use the search bar at the top of the menu to point you in the right direction.
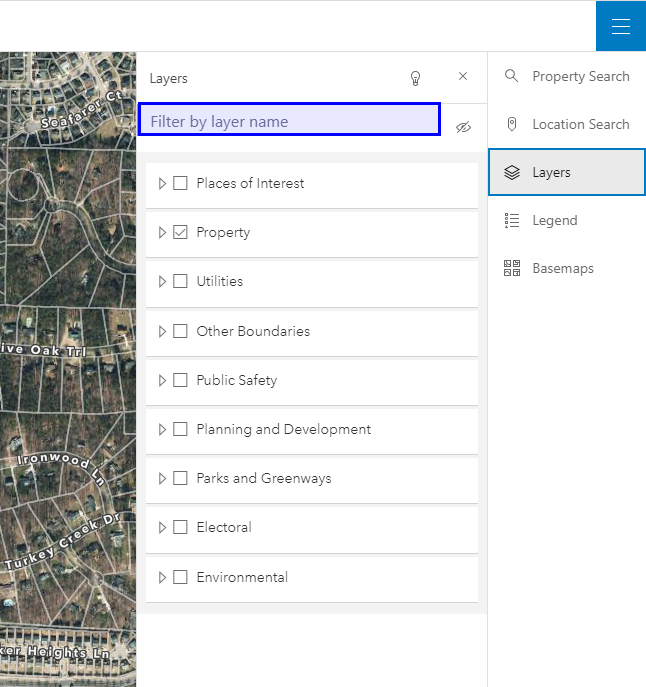
Pro Tip: When using the layers tab make sure the check box is selected for any layer you want turners on. To dive deeper into each layer set, hit the drop down arrow.
5.3.1. Utilities
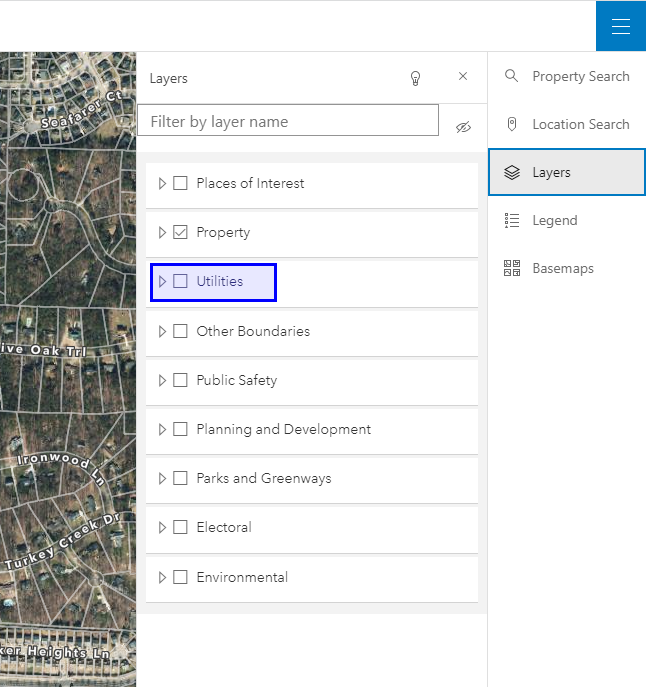
When investigating a raw piece of land, it is helpful to know if basic utilities are available at the property. Click on the Utilities layer and you will find “Raleigh Stormwater’’ and “Raleigh Sewer”. These layers give you information about where the existing storm water and sewer facilities are in place. The fresh water system is mapped but is not publicly available information. My understanding is that the County keeps water system information off of iMaps for public safety reasons. In the Utilities layer menu you can also find useful information about documented access and utility easements that may impact a property.
5.3.2. Planning and Development
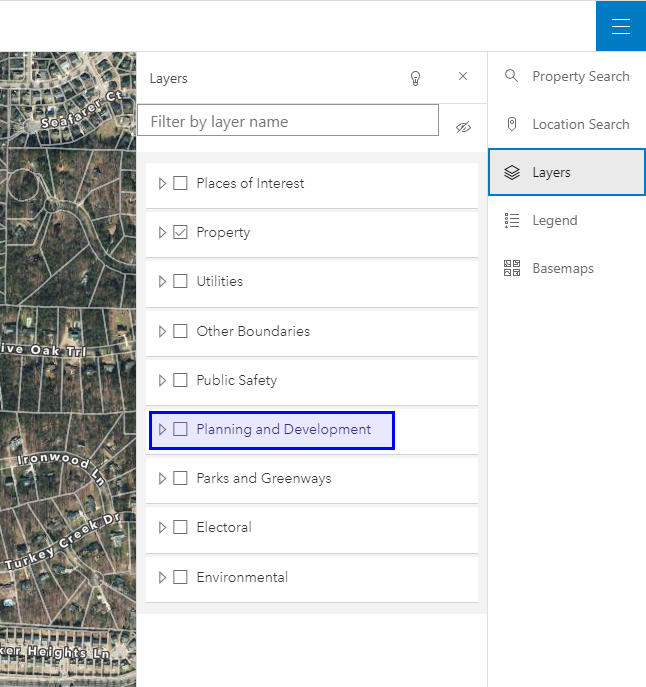
5.3.2.1. Raleigh Planning and Development
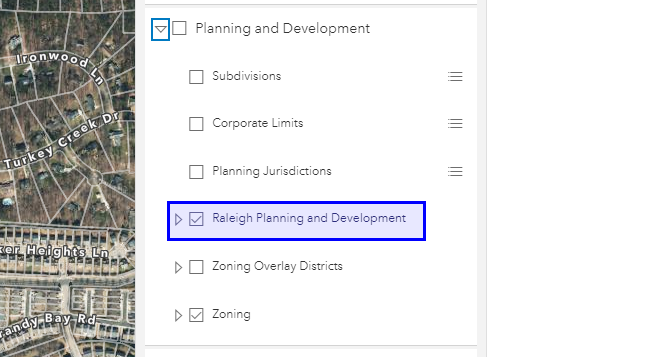
In the “Raleigh Planning and Development” you can explore Historic Properties and the Raleigh Street Plan. The most useful layer is the Future Land Use Map, which shows how the City views the future uses for land. The future land use may differ from the current property zoning which we will discuss below. The zoning layer shows the legally binding zoning that is currently in place for every parcel, and the Future Land Use Map casts a vision for the future but is not legally binding.
5.3.2.2. Zoning Overlay Districts
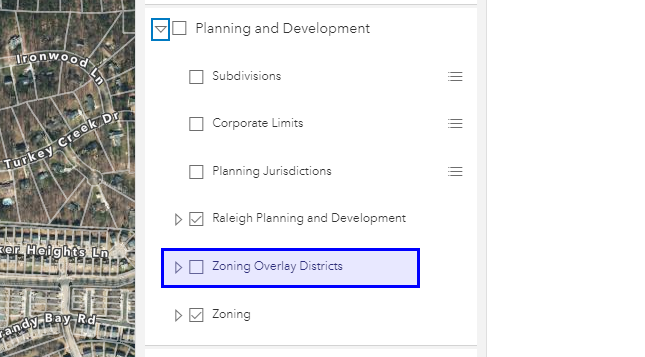
Next, take a look at the Zoning Overlay Districts Layers. Below the Raleigh Overlay Districts dropdown you will find a dozen overlay maps. Here you can explore the Airport Overlay District (AOD), various Watershed Protection Overlay Districts (WPOD), Historic Overlay Districts (HOD), Neighborhood Conservation Overlay Districts (NCOD), and Transit Overlay District (TOD). Each of these districts will apply additional regulation to the development activities that happen in the underlying parcels.
5.3.2.3. Zoning
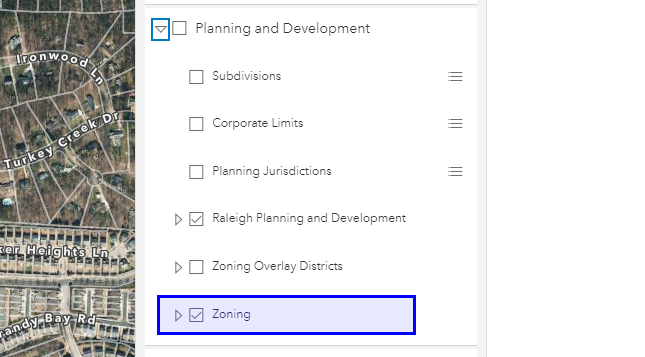
Last but not least are the Zoning layers. Parcel zoning is controlled at the municipal level, so you will see a separate layer for each municipality.
By clicking on the Raleigh Zoning sublayer a multicolor map will appear on top of the basemap for the city. Each of these colors represent an individual zoning district. The zoning of a parcel determines what is legally allowed to be built there. Zoning districts also come in different intensity levels. To best understand what each zoning district allows, look up the relevant district in the Unified Development Ordinance (UDO).
Tip: As mentioned earlier, the current zoning map differs from the future land use map. It’s fun to explore the differences between the two.
Pro Tip: The iMaps zoning information is not legally binding. If you are looking for an official zoning determination, whether you are just curious or you are buying a property, you want to request an official zoning designation letter from the City Planning Department.
5.3.3. Environmental
The Environmental layer set includes three sublayers, helpful for due diligence: USGS Blue Line Streams, Contours, and Flood Hazard Areas.
The Blue Line Stream layer shows where the USGS (United States Geological Survey) has mapped existing streams. Most municipalities limit how close you can develop to a stream, so knowing if a stream is on your subject property is valuable. The stream could affect the amount and shape of developable land on the parcel. Stream designations can change over time, so if you believe you have a stream on your property I highly recommend you engage with an engineering firm to determine the actual nature of the features on the parcel.
The Contour layer gives you topographic information about the parcel. With this information you can see how the elevation changes across the property. Large changes in elevation and steep slopes will impact how you can build on your site. You might also use certain topographic features to your benefit in development.
Most municipalities also have regulations around how much of a building or development can sit within or near a floodplain, so knowing the extent of the floodplain area on your site is important. The Flood Hazard Area (Floodplains) layer is a great place to get preliminary floodplain area information. As with streams, the floodplain boundaries can change over time. Engage an engineering firm for further due diligence, if you have a concern.
Floodplain regulations can change over time. A building may exist in a floodplain and be allowed to operate within the floodplain because it was built before the regulations became law. But, if you buy the parcel or modify the structure, the new regulations may apply. It is important to understand the current regulations in your municipality. A land use attorney or engineer may help explain the regulations.
5.4. Basemaps
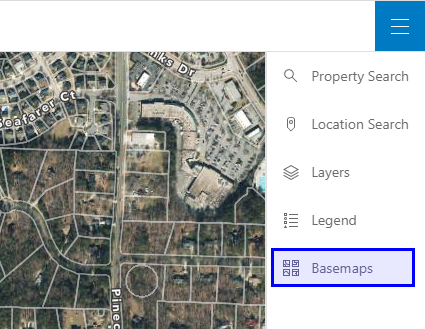
You can use the Basemaps menu to change the look of the map. You can change between Basic, Classic, Dark, and Light.
On the Basemaps tab you can also find historic imagery to explore. It can be fun to look into how the city has changed over time. The imagery goes back to 1981.
5.5. Other Features
Other features that are included on the iMaps menus are: Legend, Sketch, Bookmarks, Property Search, and Print.
Of these tools the most useful are Print and Property Search.
I use the Print feature to save PDF maps into a Due Diligence file on my computer.
The Property Search feature comes in handy to look up an address and if you are looking to see if a landowner owns multiple pieces of land in a neighborhood or across the county.
6. What to do with all of this information?
In my time in real estate I have used many different GIS systems and I can say with certainty that iMaps is one of the best systems out there. iMaps is extremely informative and user friendly compared to other systems.
At the end of the day the information is helpful, but putting the information to use is where the real magic happens.
Using the parcel area and zoning information, you can find out if a piece of land might be a viable candidate for subdividing or redeveloping to add new homes.
You can also use the zoning layer and future land map to see if the property is a likely candidate for rezoning approval.
You can use the flood hazard areas layer to see if a property is in or near a floodplain.
Ultimately you will likely want to get in touch with the landowner to see if you can make a deal! Because land ownership data is public information you can find out a lot by looking on iMaps.
7. Owner Information
First, select the parcel in question. On the right side of the screen you will see the Parcel Data. You will see the owner name, parcel address, owner address, information on buildings on the property, photographs of the property, and even recent transaction dates. You will also find links to Google Maps, the Tax Page, Deed, and Book of Maps information.
Sometimes you will see the parcel is owned by a legal entity as opposed to an individual. An investor will often purchase a property with a Limited Liability Corporation (LLC). You can often find additional helpful information about an LLC by searching the Secretary of State website. If the manager of the LLC is listed on the LLC Search you now know who to reach out to about the property.
LLC stands for Limited Liability Corporation.
8. iMaps Accuracy and Sources
I have mentioned above but it is worth repeating that iMaps is a useful tool, but any information found on the website should be taken with a bit of caution. iMaps is a tool that aggregates information, so the information is only as accurate as the source information. Some of the sources update regularly and some do not. I have even found errors and discrepancies in the data. Before making any critical due diligence decisions, double check your data against the original records and confirm with the City if possible.
9. Current Development Activity
The iMaps site is extremely helpful, but most of the data is looking into the past. If you are curious about current land use changes on a site — many of which happen before a land transaction takes place — the City Development Portal is a great place to start. Raleigh has a fantastic development portal. If you know the address of your subject property — which is easy to find on iMaps — you can conduct a search and find rezoning activity, site plan approval activity, permits that have been applied for, and much more. A rezoning or site plan approval application is often a great place to find information about the consultants and developers working on a project.
10. Conclusion
With iMaps and the information above you can measure parcels, find parcels, find owners you can contact about the property, investigate zoning and floodplains and utilities, and explore historical imagery.
Head over to iMaps right now and see what else you can learn about the land beneath your feet! With the exercises below, you will have some opportunities to put this system and your new knowledge to use. Each exercise will only take a minute or two.
11. Feedback and Application Exercises
I would love to hear from you. What other ways can you think of to use iMaps? What information did I leave out? What else would you like to know about due diligence and parcel research?
If you have any feedback, you can email me directly at [email protected] or find me on Twitter at @OakCityCRE.
Now it’s your turn to give it a shot. Below are a few application exercises that you can work through on your own to practice your new iMaps knowledge! If you can answer all of these questions and prompts you are well on your way to using iMaps like a developer!
Application Exercises:
- Measure the perimeter of the parcel where you live.
- Find the zoning of your parcel.
- What is the tax value of the parcel where your favorite restaurant is located?
- What is the distance between your home (or work) and the State Capital?
- Who owns the land under the place where you get your haircut?
- How many parcels are within 50 feet of your home parcel?
- How close is your home to the nearest Sanitary Sewer Manhole?
- How many square feet is the school building nearest to where you live?
- What is the size of Umstead State Park in Square Miles?
- How long is Fayetteville Street in Downtown Raleigh?
Resources
- iMaps Website
https://maps.raleighnc.gov/iMAPS/ - iMaps User Guide [PDF]
http://maps.wakegov.com/imaps/iMAPShelp.pdf - iMaps Help Page — Includes videos, How-To’s, and FAQ’s
https://www.wakegov.com/departments-government/geographic-information-services-gis/maps-apps-data/imaps-information - Secretary of State Search
https://www.sosnc.gov/online_services/search/by_title/_Business_Registration - Raleigh Unified Development Ordinance (UDO)
https://raleighnc.gov/unified-development-ordinance-udo


